Three years of TROPOMI measurements
Reading time: about 20 minutes
With an ever-growing world population, and the ongoing increase in energy consumption, the effects of human activity on the natural environment have never been more relevant. In order to understand and mitigate the resulting problems, such as atmospheric pollution and climate change, the whole Earth system (land, oceans, atmosphere and the interactions between them) needs to be carefully monitored. Long time series of observations from ground and space help scientists to understand the physical and chemical processes and to discriminate between natural and anthropogenic contributions to the observed changes in air quality and the climate. It is in this light that the European Commission has developed the Copernicus Earth Observation programme. It involves the development and operation of monitoring networks from ground and space and aims at open access to all resulting information.
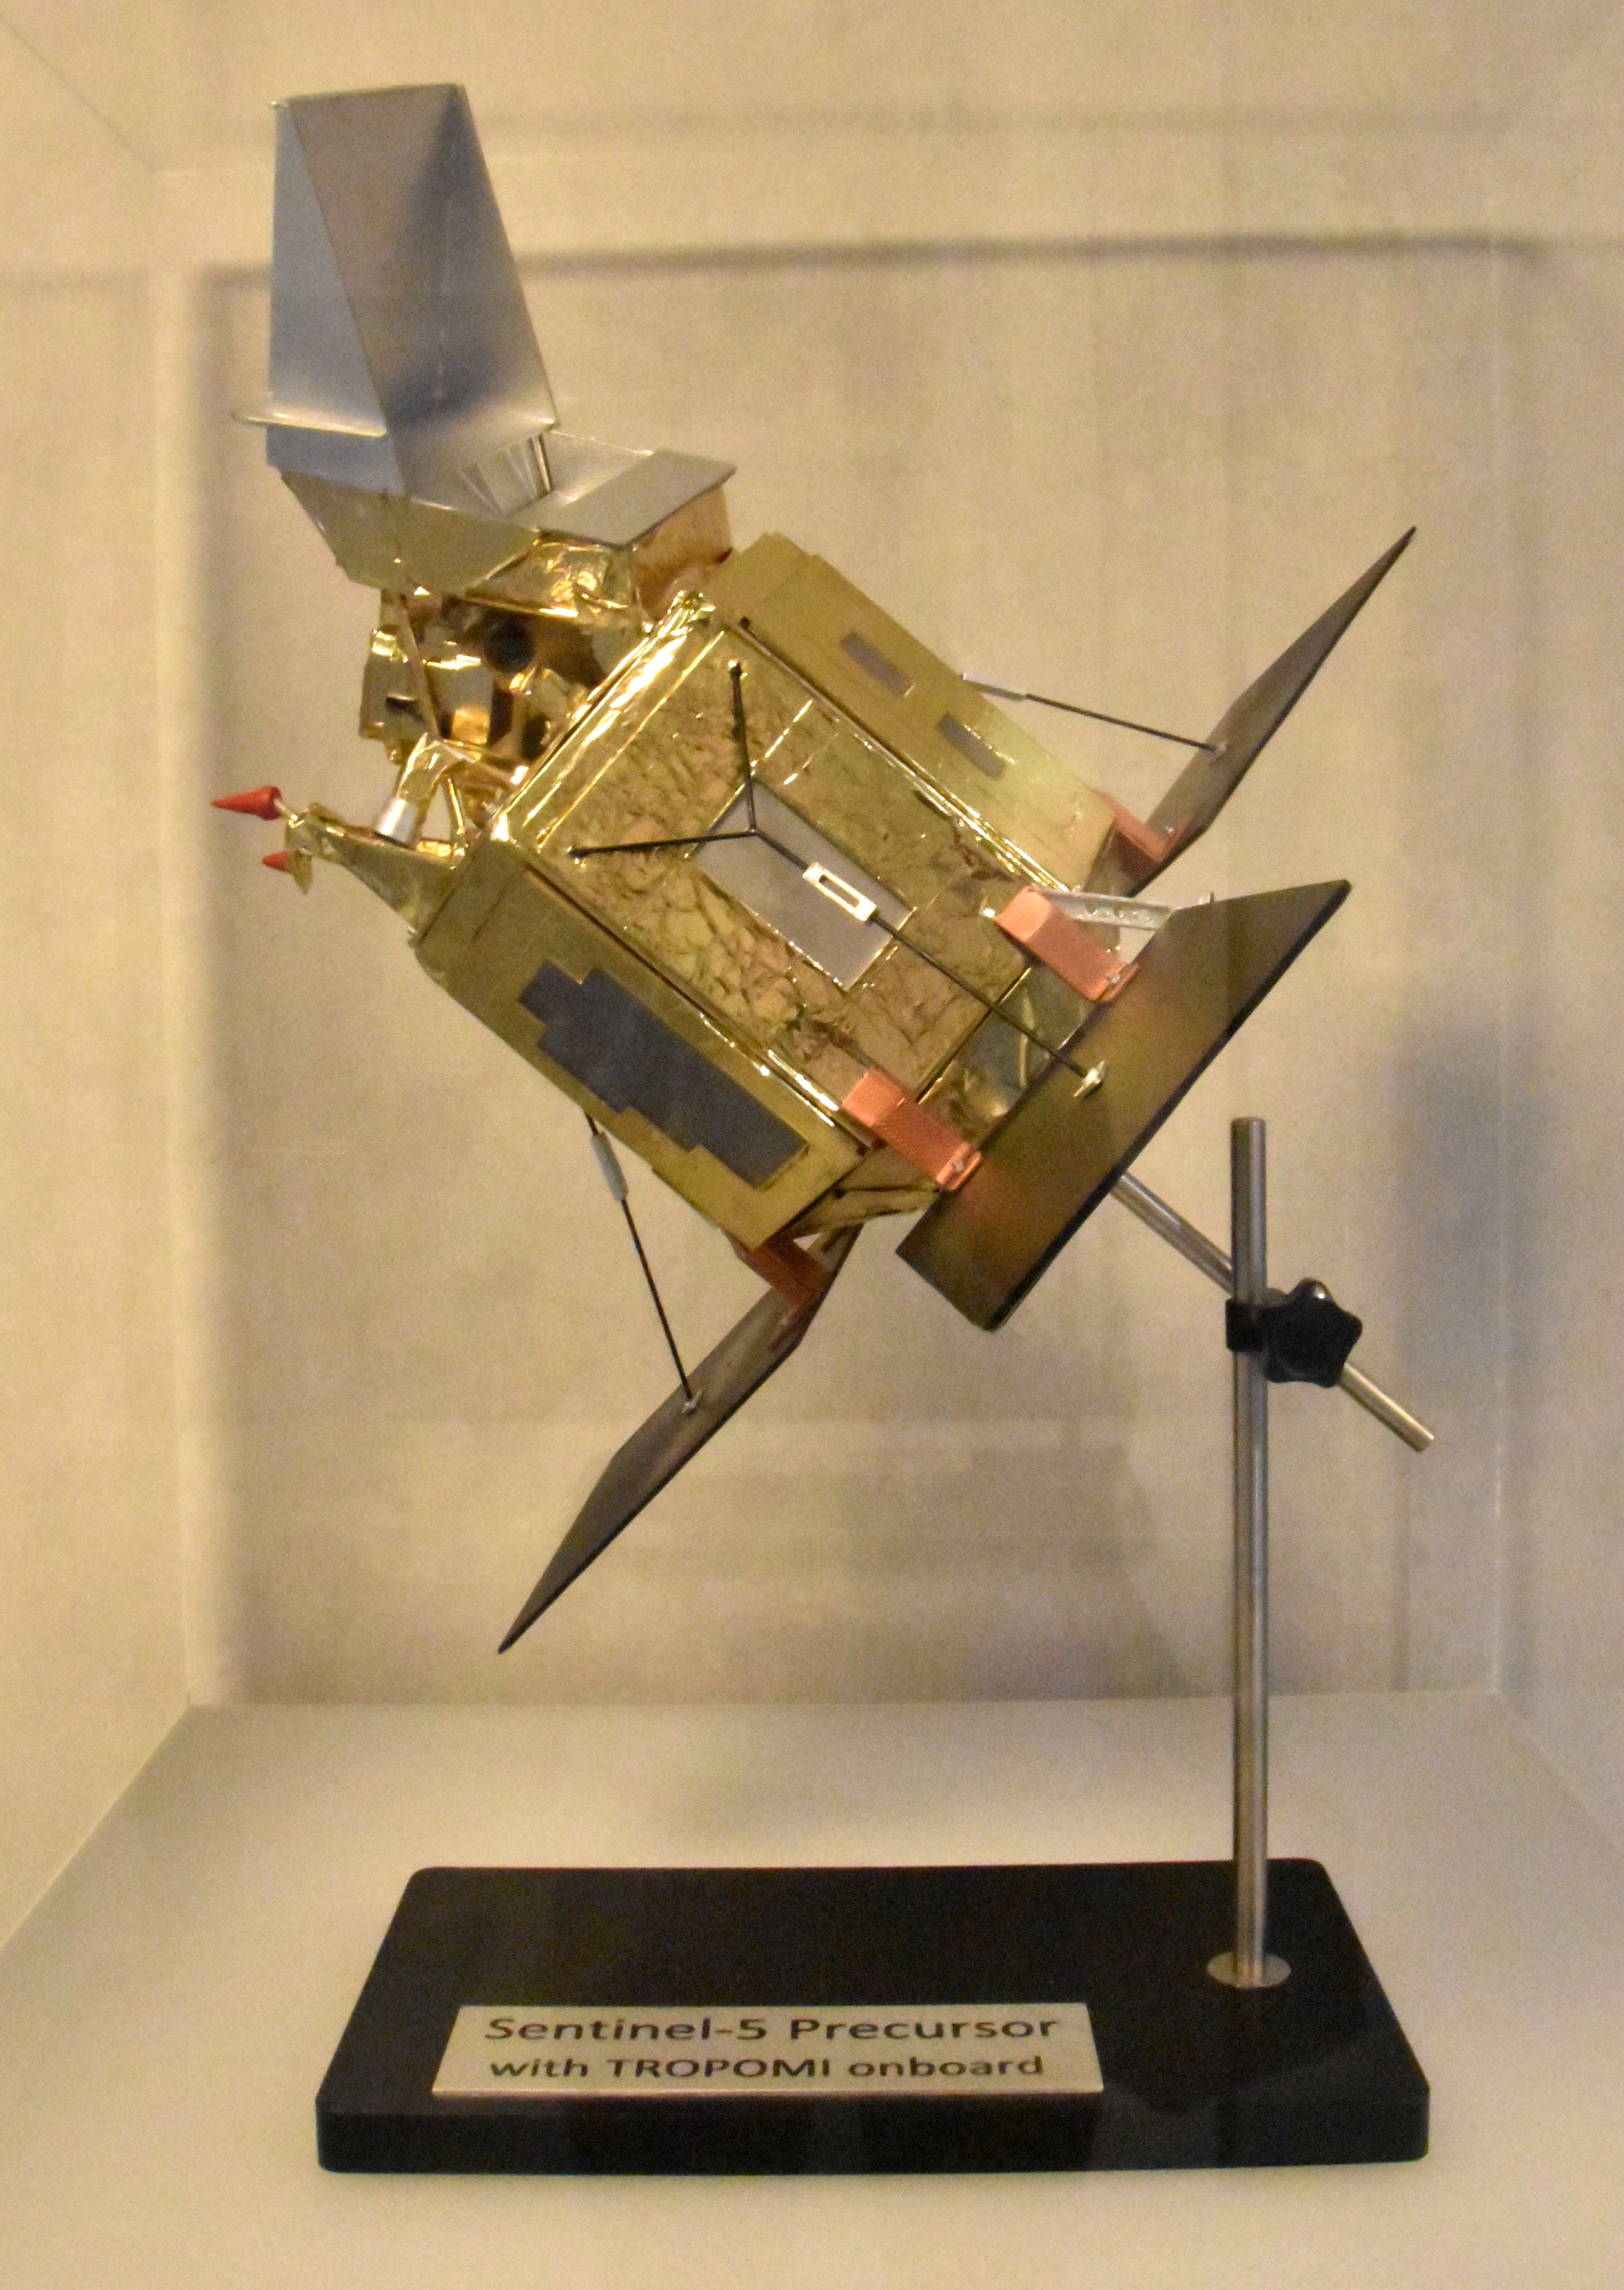
One of the components of Copernicus is a series of satellites to monitor different aspects of our planet. This “Sentinel” series is developed by the European Space Agency (ESA). Within this programme, Sentinel 5 Precursor (S-5P) is the first mission for the monitoring of atmospheric composition. It carries a single instrument, the Tropospheric Monitoring Instrument (TROPOMI). After its launch in October 2017, scientists quickly noticed that the quality of the measurements exceeded expectations and since, after three years of operational delivery of high quality observations, many spectacular results have seen the light that have further improved our understanding of the composition of the Earth’s atmosphere. April 18, 2021, marks the third anniversary of the start of the operational dissemination of TROPOMI data. Scientists at the Royal Belgian Institute for Space Aeronomy (BIRA-IASB) have been closely involved in the analysis of the data and the techniques behind it, as well as in the quality control and scientific exploitation of the measurements. Enthusiastic about the results, they want to take this opportunity of “Three years TROPOMI” to provide more information about this satellite mission and to share their most appealing results.
The Sentinel-5 Precursor mission
Reports from the European Environment Agency (EEA) and the World Health Organization (WHO) confirm regularly that air pollution is at the basis of over 400,000 premature deaths in Europe and around 7 million worldwide. Climate change and alterations of the ozone layer are also reported to have global consequences on human health and society. Efforts are being undertaken globally to study and reduce the effects of air pollution, ozone, and climate change, three phenomena that are tightly connected. The aim of Copernicus is to combine computer models and measurements from ground and satellite into an integrated system for the monitoring of both air quality and climate, as is done in Europe within the Copernicus Atmospheric Monitoring Service (CAMS) and Copernicus Climate Change Service (C3S) respectively.
Several satellite platforms are planned for monitoring atmospheric composition and air quality, such as Metop-SG with the Sentinel-5 instrument (the successor to Sentinel-5P) and the Meteosat 3 geostationary platform (MTG) carrying the Sentinel-4 instrument. However, these instruments, which will observe daily variations in the composition of the atmosphere over Europe, will not be launched for several years.
Fortunately, it was recognized that an instrument was needed to fill the time gap between the older generation of sensors and the upcoming new platforms. And so, the concept of Sentinel-5 Precursor saw the light. The mission shows many similarities to the future Sentinel-5 (hence, ‘Precursor’) and has an expected lifetime of 7 years.
The S-5P payload, the TROPOMI instrument, was developed by several Dutch research institutes, notably the Royal Netherlands Meteorological Institute (KNMI), the Netherlands Institute for Space Research (SRON) and the Netherlands Organisation for Applied Scientific Research (TNO). With a total mass of 220 kg, it consists of spectrometers that are sensitive of a broad spectrum of colours (wavelengths) in the ultraviolet/visual range and in the near-infrared domain. The wavelength sensitivity was chosen such that a maximum number of atmospheric constituents relevant to air quality and climate can be observed.
Watching from above
When considering “air”, the main ingredient of the Earth’s atmosphere, most people know that it largely consists of the gaseous components nitrogen (78%) and oxygen (21%). Yet, traces of hundreds of other gases can be found that together constitute the final 1%. It is thanks to these trace gases that the greenhouse effect exists or that we are protected from the high-energy UV radiation emitted by the sun, making our planet habitable. At the same time, changes in their abundance can lead to phenomena like global warming (enhanced greenhouse effect) and reduced air quality (pollution).
The atmosphere is a relatively thin layer, reaching up to about 100 km from the Earth’s surface. To determine the composition of this ‘egg-shell’, TROPOMI cannot analyse the air directly (as opposed to certain instruments on the ground, balloons and planes that sample the air directly), because the satellite orbits the Earth at an altitude of about 800 km. Instead the TROPOMI instrument uses spectroscopic techniques to analyse sunlight that has passed through the atmosphere and is reflected by the earth’s surface or scattered by the air molecules towards the instrument. By comparing the received light spectrum with daily direct measurements of the sun (light that has not passed through the atmosphere), the composition of the atmosphere at the time of measurement can be derived. The final derived quantity is the total gas amount in the vertical atmospheric column above the measurement location.
S-5P orbits the Earth in such a pattern that it crosses the equator from south to north at 13h30 local time at each orbit. Each orbit has a duration of 100 minutes during which the TROPOMI instrument measures a strip of the atmosphere of 2600 km wide. With the Earth rotating beneath the satellite, each newly measured strip is positioned just west to the one before, implying that TROPOMI samples the entire atmosphere in a 24 hour period (Figure 1).
It’s all in the details
Is TROPOMI the first satellite instrument that can determine the composition of the atmosphere? Not at all! But the achievements of TROPOMI are remarkable through its improved sensitivity and enhanced spatial resolution. The first aspect means that the instrument can also detect weaker pollution sources that were often overlooked before, but are highly relevant when studying air quality and climate, because of their large number.
When comparing TROPOMI to its predecessors, particularly striking is its enhanced spatial resolution. The ground pixel size can be thought of as the area of the smallest details that the instruments can observe, not unlike the pixels of a digital camera. The ground pixel size of TROPOMI is 5.5 × 3.5 km2. This may not seem small in comparison to what other instruments achieve, for example the Sentinel-2 imager that is capable of reaching a resolution of 10 m, but one has to remember that the spectroscopic measurement technique is very different from the direct observation of objects on the ground and the progress made with respect to previous atmospheric instruments is quite spectacular (Figure 2).
One picture…
As the saying by Confucius goes: one picture is worth a thousand words, and this certainly holds for the results that have been obtained with TROPOMI so far. In this section, we present a selection of images, illustrating the observed distribution of several important pollutant gases, together with a brief discussion of their relevance.
Multi-year maps
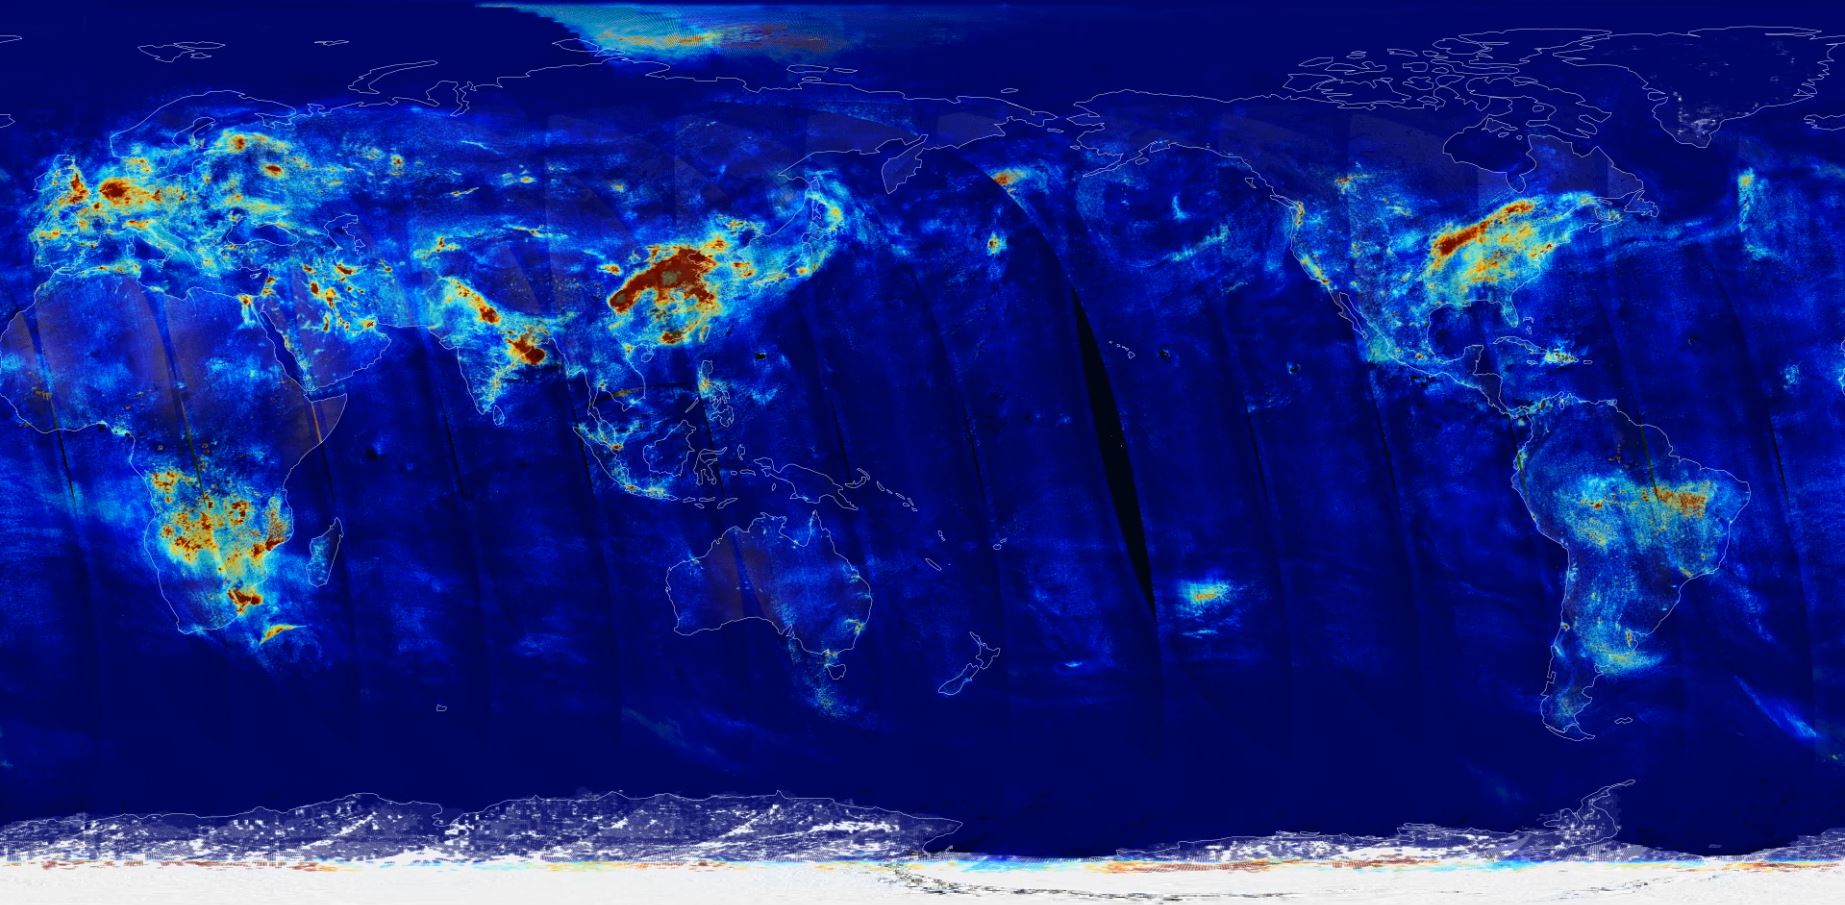
TROPOMI observes the entire atmosphere daily, but sometimes the molecules of interest are hidden from view by clouds or dust, or the concentration is too low to be detected. Aggregation of measurements over a longer time period allows for the reduction of the impact of lower quality measurements and reveals a myriad of weaker sources that otherwise would remain undetected. Figure 3 shows global TROPOMI maps of the average trace gas distribution over almost the entire TROPOMI mission so far (2.5 - 3 years). Several maps can also be downloaded as PDF files.
The international efforts to reduce the impact of the global energy consumption and the human footprint are ever increasing, but for now the use of non-renewable fossil fuel continues to grow. The combustion of oil, coal, and gas is responsible for raising atmospheric levels of carbon dioxide (CO2), one of the major causes of global warming. Combustion processes from heating systems, power generation, and engines (traffic) release large amounts of CO2 and other polluting species into the atmosphere, such as nitrogen dioxide (NO2) and sulphur dioxide (SO2), that both are observed by TROPOMI.
When consulting the map of NO2 in Figure 3, one can immediately see that the most elevated amounts are found in areas of concentrated economic or industrial activity, such as the eastern United States, the Middle East, or Europe. NO2 is a reactive gas that is involved in the creation of ozone and fine dust (smog) and is known as an irritant to the human respiratory system.
As mentioned earlier, TROPOMI also observes sulphur dioxide, another pollutant that acidifies the atmosphere (acid rain) and can cause throat and lung irritation, especially to those who already suffer from respiratory problems. Around two-thirds of the SO2 content of the atmosphere can be subscribed to human activity, with the remainder originating from volcanism.
The SO2 concentration in Europe (which used to cause acid rain) was drastically reduced over the last decades by use of higher quality fuels and desulfurization systems in industry. Not so, however, in other regions in the world, where the use of sulphur-containing fossil fuels and ore smelting is often responsible for severely deteriorated air quality. As such, TROPOMI plays an important role in the monitoring of the evolution of the global SO2 emission. The global TROPOMI SO2 map in Figure 3 clearly shows elevated SO2 amounts over eastern China, India, and the Middle East.
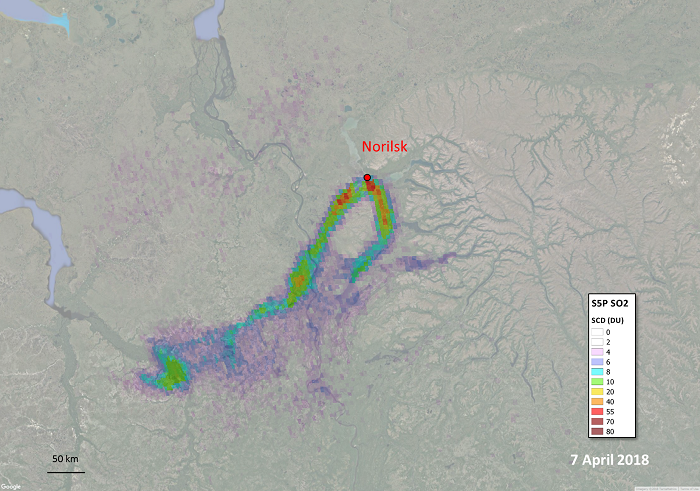
A particular interesting anthropogenic source of SO2 emission is the industry in the Siberian town of Norilsk, notorious for its pollution of the surrounding landscape and atmosphere. The smelting processes there produce a steady outflow of SO2 that can be followed along the nearby rivers and side valleys in the TROPOMI measurements (Figure 4).
It’s all natural, or is it?
Most of the NO2 and SO2 in the atmosphere is the result of human activity, but for other polluting species, the discrimination between natural and anthropogenic contributions can be more complicated. An example is formed by the family of volatile organic compounds (VOC), molecules that take part in complex chemical reaction chains that affect air quality through the formation of tropospheric ozone (O3) and aerosol particles. VOC’s originate from industry and traffic, but are also produced in vegetation areas and forest fires. Because of this mixed origin, careful determination of the natural and anthropogenic VOC amounts are necessary in order to study air quality and effects on climate. Unfortunately, VOC’s cannot be measured directly from satellite and their quantification is done by measuring formaldehyde (HCHO) and glyoxal (CHOCHO), which are both secondary products in the photochemical degradation of VOCs and can be observed by TROPOMI. On average the HCHO and CHOCHO molecules only reside for a few hours in the atmosphere before being chemically destroyed, meaning that they are usually not transported far from their emission source by the wind. This facilitates the discrimination between natural and human sources. This information is then used in computer models that simulate the atmospheric chemistry and transport, which improves our knowledge of ozone formation and the effects on climate. The global formaldehyde and glyoxal maps in Figure 3 show the natural sources from vegetation over Central Africa and the Amazonian forest, whereas the elevated concentrations in East Asia are primarily due to industrial pollution.
Natural events
Chemical species in the atmosphere can pose a direct threat to the environment or human and animal life in case of natural disasters, such as wildfires or volcanic eruptions.
Forest fires
Forest fires can be responsible for the emission of large quantities of formaldehyde, glyoxal and other species in a relatively short time. TROPOMI observed unprecedented amounts of HCHO and CHOCHO emitted during the Australian bush fires of 2019-2020 and again during the wildfires in California.

Monitoring this type of events is of particular interest as it can be expected that the number of fire events and their intensity will increase in future years, as a results of global warming. Such large-scale fires can have a severe impact on air-quality, in particular when the emitted particles and gases are transported by wind over longer distances. In this respect, the Australian and Californian forest fires have shown the importance of long-range transport (1000 km and more) of carbon monoxide (CO) and even short-lived species like formaldehyde and glyoxal. As said earlier, the first two gases normally only survive for a few hours in the atmosphere and their presence at such long distances from the source suggests that other chemical species, responsible for their creation, are also emitted by the fires and continue to create detectable quantities of formaldehyde and glyoxal.
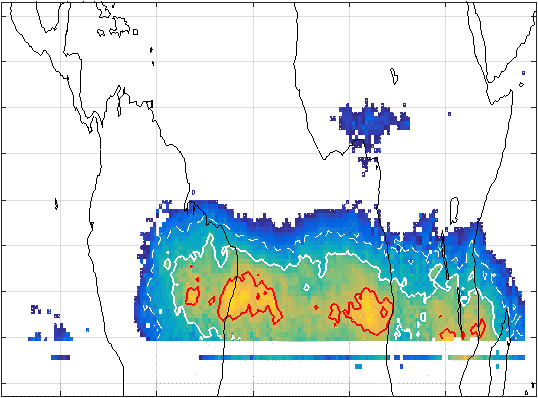
Like formaldehyde and glyoxal, carbon monoxide has natural and anthropogenic sources, with its role as a pollutant being most obvious in populated areas (fossil fuel combustion). In natural environments, oxidation with hydrocarbons or biomass-burning are the most relevant sources. But unlike formaldehyde and glyoxal, carbon monoxide has a relatively long lifetime (weeks to months), making it an ideal tracer of long-range transport mechanisms. As an example, Figure 6 shows the CO transport across the Pacific from Australian wildfires in 2019-2020.
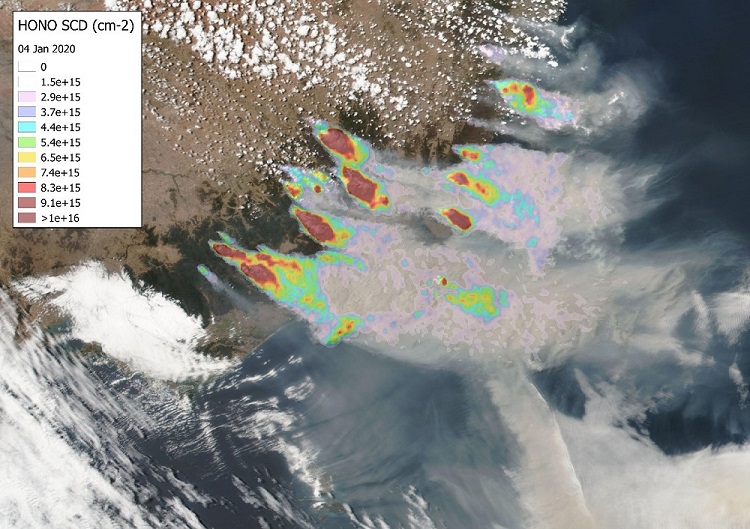
One of the most recent discoveries in TROPOMI data made by BIRA-IASB scientists was the consistent presence of nitrous acid (HONO) in wildfire plumes, and the work was described extensively in an article in the prestigious journal Nature ("Globale nitrous acid emissions..."). The interest in detecting HONO lies in the fact that it is a precursor of the so-called hydroxyl radical (OH) that plays an important role in the degradation of greenhouse gases and the creation of smog and ozone. For detailed knowledge of the involved chemistry it is therefore important to accurately determine the HONO quantities released into the atmosphere. Reliable observations to do this where, however, lacking so far. In cooperation with the University of Colorado, BIRA-IASB researchers discovered consistently enhanced HONO amounts, especially near the source of the fires, using global TROPOMI measurements of wildfire plumes in a variety of ecosystems (Figure 7).
Volcanic eruptions
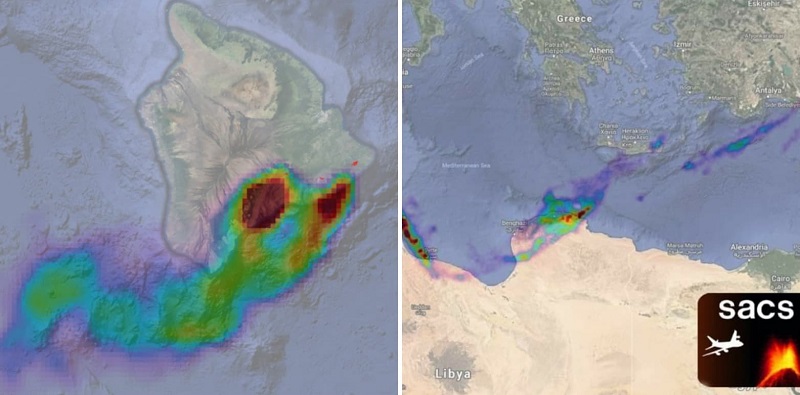
Another type of natural event that can have disastrous effects on its surroundings is formed by volcanic eruptions. Powerful eruptions not only pose a threat to the immediate environment, but the emitted ash and SO2 clouds can also be harmful to air traffic and the health of the passengers even at long distances away from the source. The enhanced spatial resolution of TROPOMI allows for early characterization of eruption events and more reliable monitoring of the transport of SO2 clouds (Figure 8). The instrument was therefore happily welcomed by the Support to Aviation Control Service (SACS), a platform operated at BIRA-IASB that provides information on volcanic eruptions from a range satellite platforms and emits alerts to the Volcanic Ashes Advisory Centres supporting international aviation control.
Climate
When it comes to the mechanisms behind the world’s changing climate, the focus is often on the human contribution to emissons of carbon dioxide (CO2). Yet, there are other greenhouse gases that need to be investigated just as thoroughly, such as methane (CH4) and ozone (O3). The number of methane molecules in the atmosphere is much less than for carbon dioxide. Yet, methane molecules have a much higher capacity to warm up the atmosphere and its incorporation in climate studies is therefore highly relevant. The increase in the atmospheric methane concentration over the years has not always been regular and much about its creation and destruction is yet to be understood. TROPOMI is the first instrument to map the global methane content at high resolution at a daily basis. BIRA-IASB plays an important role in the validation of the methane measurements, assuring that the uncertainties are small enough to use the results in climate studies. See Figure 3 for the global methane distribution as seen by TROPOMI.
The presence of ozone in the stratosphere, this is above approximately 10 km, protects us against harmful ultraviolet radiation from the sun. Closer to the ground, however, it acts both as a pollutant and a greenhouse gas. For a thorough understanding of the role of this tropospheric ozone, its amount needs to be determined with high accuracy, which is not easily done from space because of the interference of the much larger stratospheric column. BIRA-IASB scientists have carefully analysed the TROPOMI detections of tropospheric ozone in the tropics and have compared the results with those of other instruments such as those obtained in situ with balloons. From this, TROPOMI proves to be an important step forward in tropospheric O3 characterisation, clearly revealing the impact of e.g. forest fires and various meteorological phenomena.
Besides tropospheric ozone, measurements of TROPOMI are also highly relevant in the monitoring of the total vertical ozone column. Ozone has a link with climate, as it absorbs radiation from the sun (stratosphere) and the Earth’s surface (troposphere). This altitude-dependent effect on climate makes the monitoring of the total ozone column an essential activity in the study of climate and other atmospheric phenomena, such as the Antarctic ozone hole. TROPOMI total ozone time series are an important ingredient of climate data records procuded by projects such as ESA’s Climate Change Initiative (CCI) and the Copernicus Climate Change Service (C3S).
The truth and nothing but the truth
Ideally, the derived trace gas amount from the TROPOMI data should reflect the actual amount at the time of measurement. But despite all careful calculations and many years of preparations, the performance of any new satellite instrument will only fully reveal itself after launch and comparing results between instruments usually show some degree of difference. Measurement uncertainties can vary according to numerous parameters and are usually due to a mixture of instrumental characteristics, circumstances in space, approximations in the applied software, and atmospheric conditions. For the study of air quality, ozone and climate, demands on the measurement quality are high and the uncertainties need to be carefully monitored, analysed and understood. In the framework of the ESA/Copernicus Mission Performance Centre for Sentinel-5P, the trace gas products derived from TROPOMI measurements are monitored in an automated way through a validation facility (VDAF) operated at BIRA-IASB, in collaboration with European partners. In addition, extensive validation campaigns are regularly organised where TROPOMI measurements are compared with those from reference instruments deployed on the ground or on aircraft. BIRA-IASB also contributes to the establishment of observation systems providing reliable reference data sets from measurement stations strategically distributed around the globe (FRM4DOAS, FRM4GHG). Tailored to the specific needs of satellite validation these so-called Fiducial Reference Measurements (FRM) are to be considered as the most reliable source of reference and will also be used for the validation of data from the future Sentinel-4, Sentinel-5 and CO2M missions.
Figure 10. Excellent agreement between TROPOMI and ground-based reference measurements of the total ozone column at Kerguelen Island, as revealed by the automated comparisons in the Validation Data Analysis Facility (VDAF).
Taking the next step
As described before, TROPOMI can directly measure details in the trace gas distribution down to a scale of 5.5 × 3.5 km2. Although this is a huge step forward with respect to previous satellite sensors, it still means the satellite cannot detect the pollution levels at the scale of neighbourhoods or streets. On top of that, TROPOMI observes most parts of our planet only once per day, at the same local time. This means that no information is obtained on the daily variation in the concentration of polluting species.
It is therefore planned to improve the information from pollution monitoring by combining the results of multiple satellites. Among those are polar orbiting platforms like S-5P and the future Sentinel-5, and the geostationary instrument Sentinel-4. The latter will have a fixed view on Europe only, but has the advantage that it will sample the atmospheric composition every hour. A further goal is to improve on the spatial and temporal resolution in such a way that, for example, the pollution from low-emission zones in urban areas can be monitored. Achieving this goal will require the development and launch of new satellite instruments with even higher resolution than TROPOMI. However, with support from the Belgian Science Policy Office (BELSPO), and in cooperation with the Belgian Interregional Environment Agency (IRCEL - CELINE), BIRA-IASB scientists have undertaken the first step in that approach by trying to improve on the spatial resolution of nitrogen dioxide maps. This can be done by collecting TROPOMI data over longer time periods (weeks to months) and carefully taking additional information on board, like the quality of each measurement, and the local wind direction and speed during the observations. Figure 11 gives an example of results obtained with this approach for Brussels. As can be seen, the derived high-resolution map shows much more information on the intra-urban distribution of NO2 than single measurements of TROPOMI can provide.
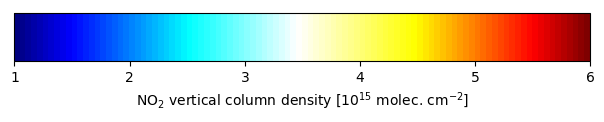
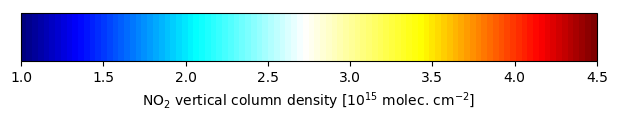
Figure 11. Top: A map of original TROPOMI NO2 measurements for one specific date (one single overpass); Bottom: a map of the NO2 distribution over Brussels at an enhanced spatial resolution of 1×1 km2. The high-resolution map was generated by combining selected information from three months of TROPOMI NO2 measurements (summertime 2020) and taking into account local meteorological information.
But also at the level of satellites further enhancements in spatial resolution can be expected, from future instrument generations. Resolutions of 1×1 km2 have already been demonstrated and proposals exist for scales of 500 × 500 m2 and less. The small ground pixel size would imply that daily global coverage is not feasible, but these instruments would likely fly on small satellites or high altitude pseudo satellites: unmanned aircraft or balloons that reside at more than 20 km altitude for months or even years in a row. They will operate in support of global missions like Sentinel-5 and would zoom in on emission sources of high interest.
However, even at enhanced spatial resolution, the TROPOMI results do not provide entirely the data that are interesting for an assessment of air quality on the ground. After all, the TROPOMI pixels show the total vertical gas column above a certain location, rather than the pollution concentration close to the surface, where human and animal life takes place. Estimating surface concentration from a total column measurement is not straightforward, as the vertical distribution of the measured species is in general not known. In the next years, scientists from BIRA-IASB will continue to work on this topic. By using advanced computer models that describe the local atmospheric chemistry, and by applying machine learning techniques, it is expected to find a reliable relationship between vertical column and surface concentration.
Improvement is also expected in the techniques that derive the vertical column amounts from TROPOMI’s spectral data. Having a more sensitive satellite sensor at ones disposal not only means that weaker sources can be detected, but also implies that the limitations of the used retrieval software become more visible. This can actually be seen as an advantage, as it allows scientists to do further research and improve on their techniques. TROPOMI results have shown that the DOAS technique has its limitations when trying to detect trace gas species that do not absorb that much sunlight and are therefore hard to detect. Small imperfections in the TROPOMI instrument and those related to our imperfect knowledge of atmospheric processes then produce 'noisy' maps, for example in the case of formaldehyde (HCHO) or small sources of sulphur dioxide. Recent research at our institute has led to an alternative method that provides much ‘cleaner’ maps and allow for the detection of even weaker sources. This method will be further fine-tuned in the next years.
Not all new scientic developments based on TROPOMI data will be made available through the official Copernicus distribution channels, for example because a similar product already exists or because the new product is relevant only for a specific local user community. Because of this latter aspect, the so-called Copernicus Collaborative Ground Segments exist, that aim at providing satellite data products that answer to the needs of local users.
For Belgium, this system is called Terrascope and is hosted by VITO. BIRA-IASB has recently contributed to Terrascope by providing global data for TROPOMI vertical column products of nitrogen dioxide and carbon monoxide, that can be consulted through the Terrascope viewer. More S-5P/TROPOMI contributions to Terrascope from BIRA-IASB are expected in the next years.
S-5P/TROPOMI maps for download
Based on TROPOMI results, scientists from BIRA-IASB produced full colour, high resolution maps of some of their favourite trace gas species. They can be freely downloaded here.
Contact
Dr. Jeroen van Gent
Email: jeroen(dot)vangent(at)aeronomie(dot)be
Service "UV-visible observations" at BIRA-IASB
References
- Copernicus programme
- Theys, N., R. Volkamer, J.-F. Müller, K. J. Zarzana, N. Kille, L. Clarisse, I. De Smedt, C. Lerot, H. Finkenzeller, F. Hendrick, T. K. Koenig, C. F. Lee, C. Knote, H. Yu, and M. Van Roozendael: Global nitrous acid emissions and regional oxidants levels enhanced by wildfires, Nat. Geosci., (2020) - www.nature.com/articles/s41561-020-0637-7
- Hubert, D., Heue, K.-P., Lambert, J.-C., Verhoelst, T., Allaart, M., Compernolle, S., Cullis, P. D., Dehn, A., Félix, C., Johnson, B. J., Keppens, A., Kollonige, D. E., Lerot, C., Loyola, D., Maata, M., Mitro, S., Mohamad, M., Piters, A., Romahn, F., Selkirk, H. B., da Silva, F. R., Stauffer, R. M., Thompson, A. M., Veefkind, J. P., Vömel, H., Witte, J. C., and Zehner, C.: TROPOMI tropospheric ozone column data: Geophysical assessment and comparison to ozonesondes, GOME-2B and OMI, Atmos. Meas. Tech. Discuss., https://doi.org/10.5194/amt-2020-123, 2020.
-
van Gent, J., Danckaert, T., Theys, N., De Smedt, I., Lerot, C., Langerock, B., & Sha, M. K. (2024). Multi-year TROPOMI trace gas columns, created on the occasion of three years S-5P/TROPOMI (Version 1.0) [Data set]. Royal Belgian Institute for Space Aeronomy. https://doi.org/10.18758/UZULLS25
![]()
News image 1
News image legend 1
News image 2