Body text
To enable climate change mitigation, it is crucial to monitor the trends and variability of greenhouse gases (GHG) and to understand their emission sources and sinks.
BIRA-IASB has a long-standing expertise in performing observations of the concentrations of these gases in the atmosphere. Its ground-based remote sensing observations provide the total amount of gas in the column from the Earth’s surface to the top of atmosphere. The in situ observations measure the local atmospheric concentrations close to the instrument.
The data are part of international monitoring networks such as:
- NDACC - Network for the Detection of Atmospheric Composition Change
- TCCON - Total Carbon Column Observing Network
- ICOS European Research Infrastructure - Integrated Carbon Observation System
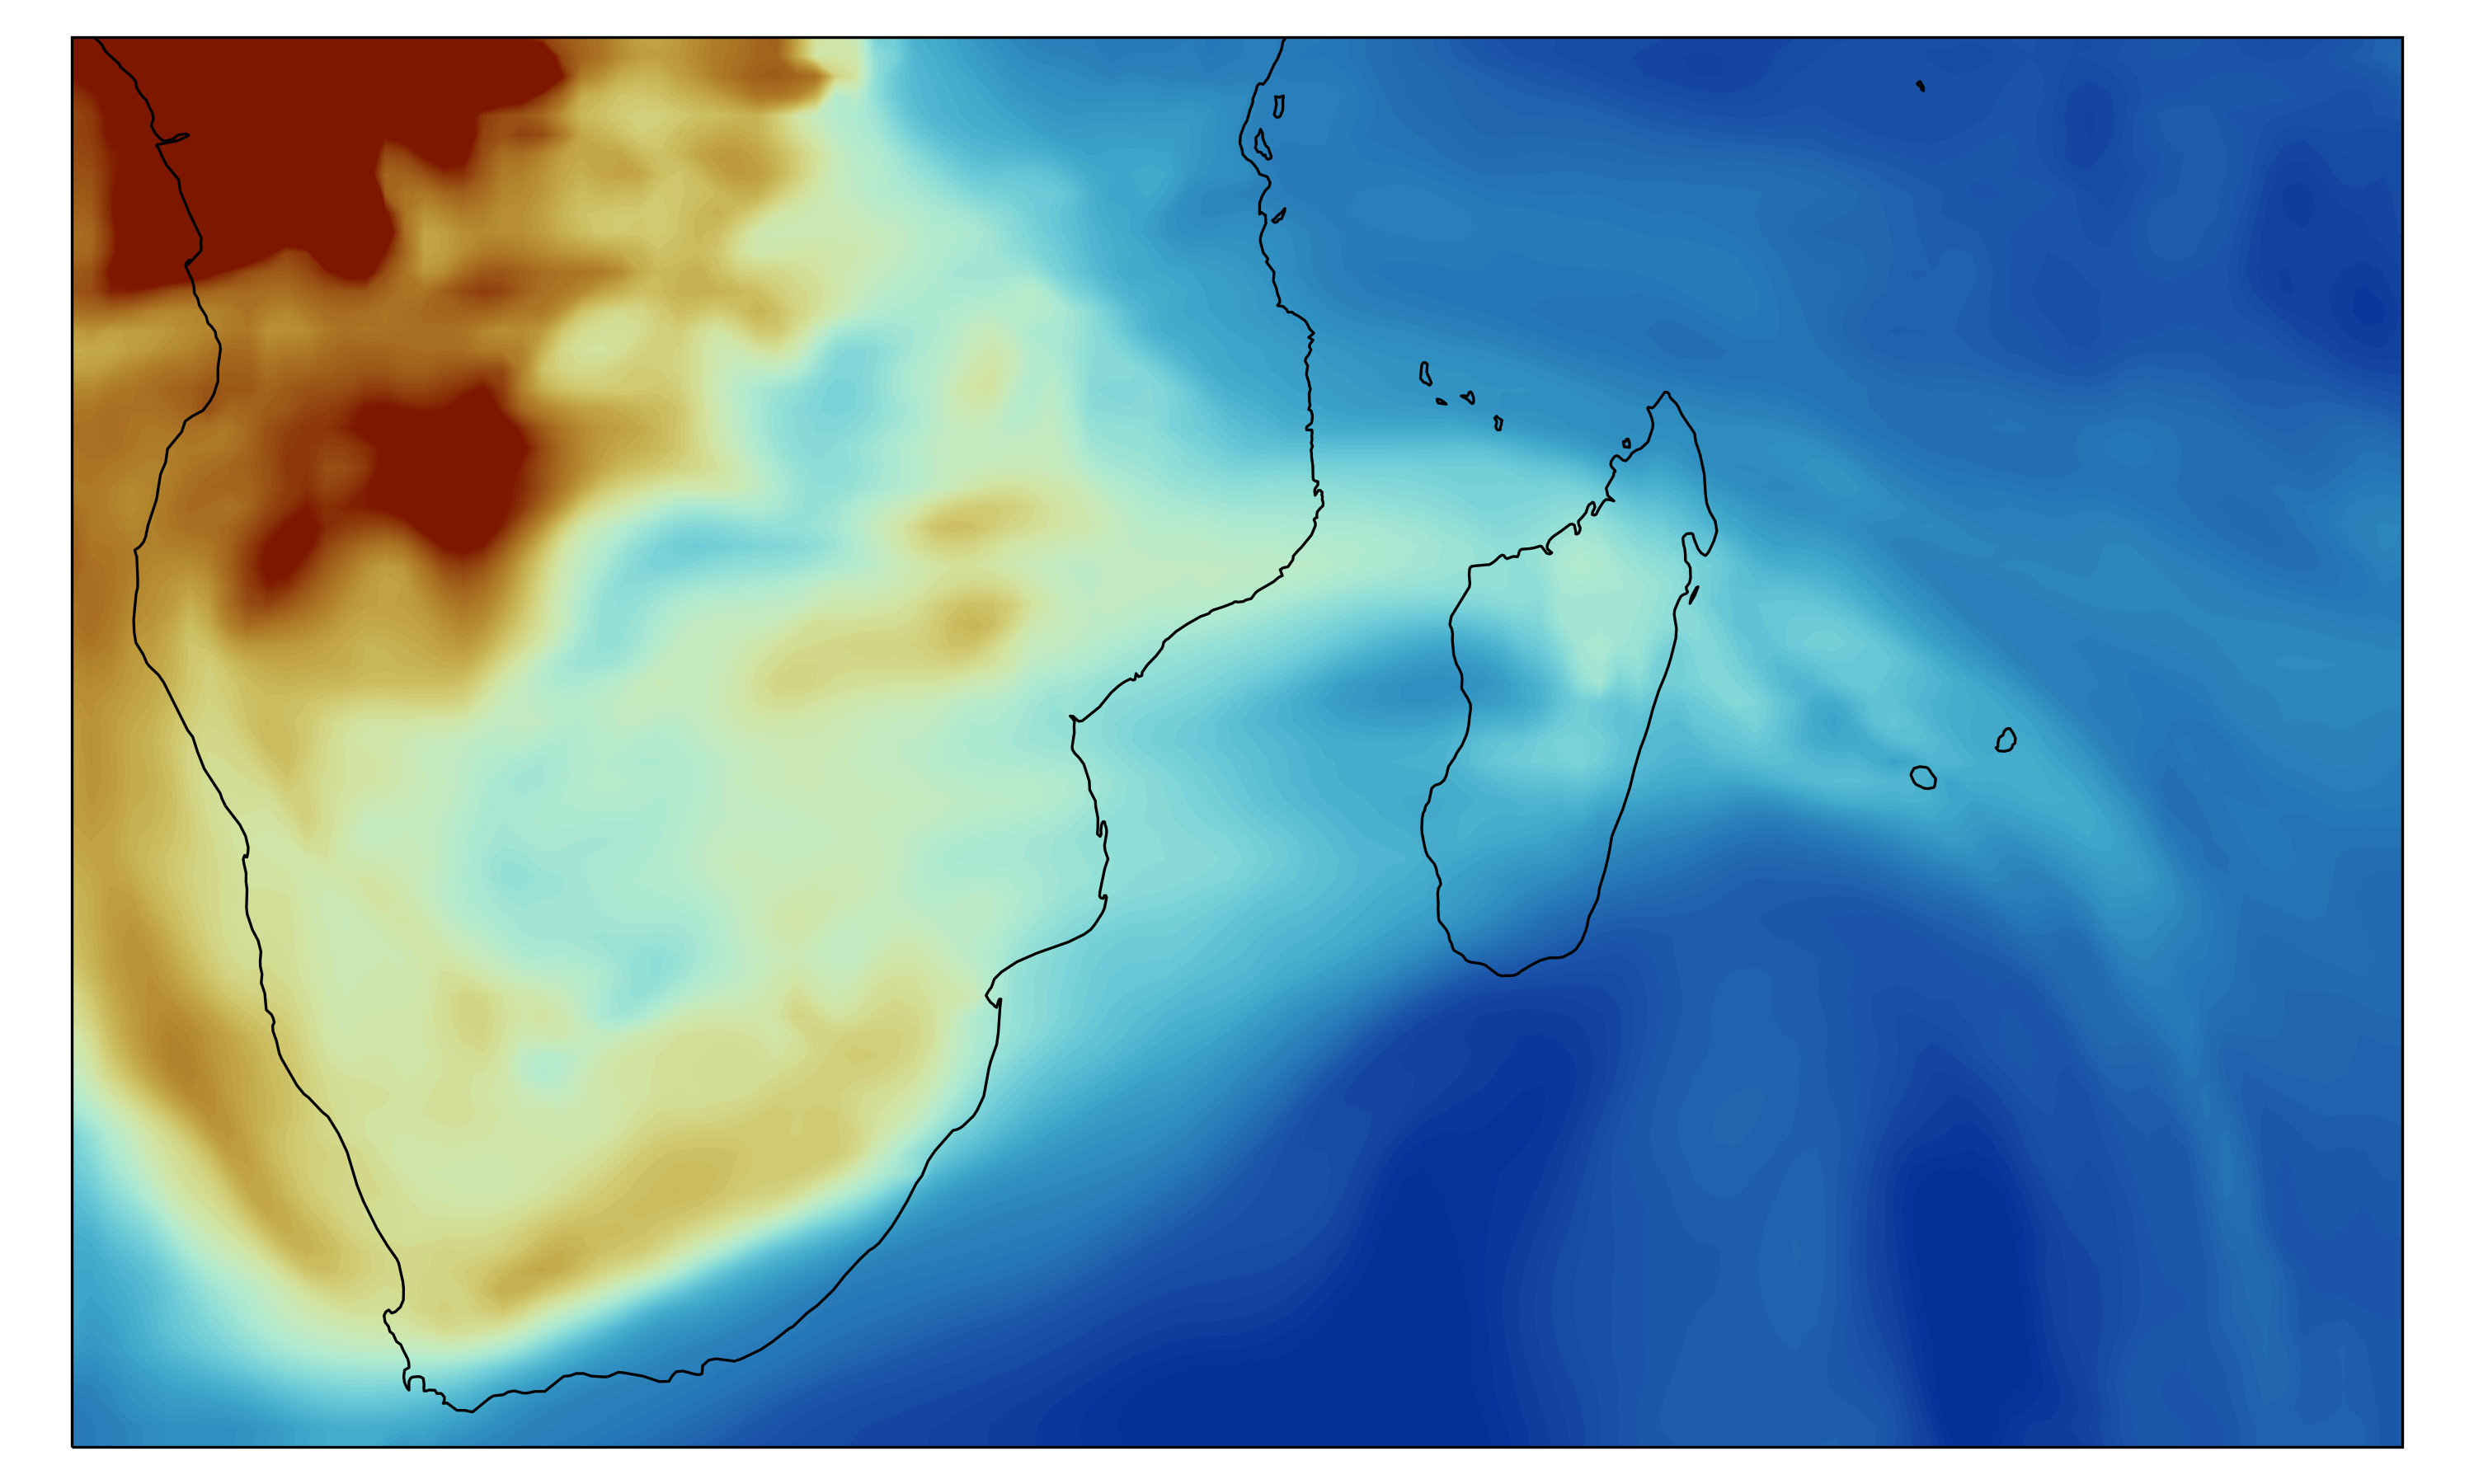
One of the stations where BIRA-IASB is performing such measurements is located at Réunion Island, in the Southeast Indian Ocean. To gain a deeper understanding of the observed time series, we have simulated them with an atmospheric transport model, called WRF-GHG.
Atmospheric model
WRF-GHG is a specific option of the widely used dynamic Weather Research and Forecasting model coupled with Chemistry (WRF-Chem). WRF-GHG simulates the propagation of CO2, CH4 and CO in the atmosphere and their emission sources and sinks at the Earth's surface.
In the WRF-GHG option, the regional atmospheric transport and surface-atmosphere fluxes of CO2, CH4 and CO are simulated without chemical reactions with other species. This is a valid assumption since these gases have long lifetimes.
The model output consists of hourly 3D-concentration fields. We simulated almost 2 years of observations of the target gases at Réunion Island and found a good agreement between the simulated and observed time series.
Results
Local emissions and dynamical processes
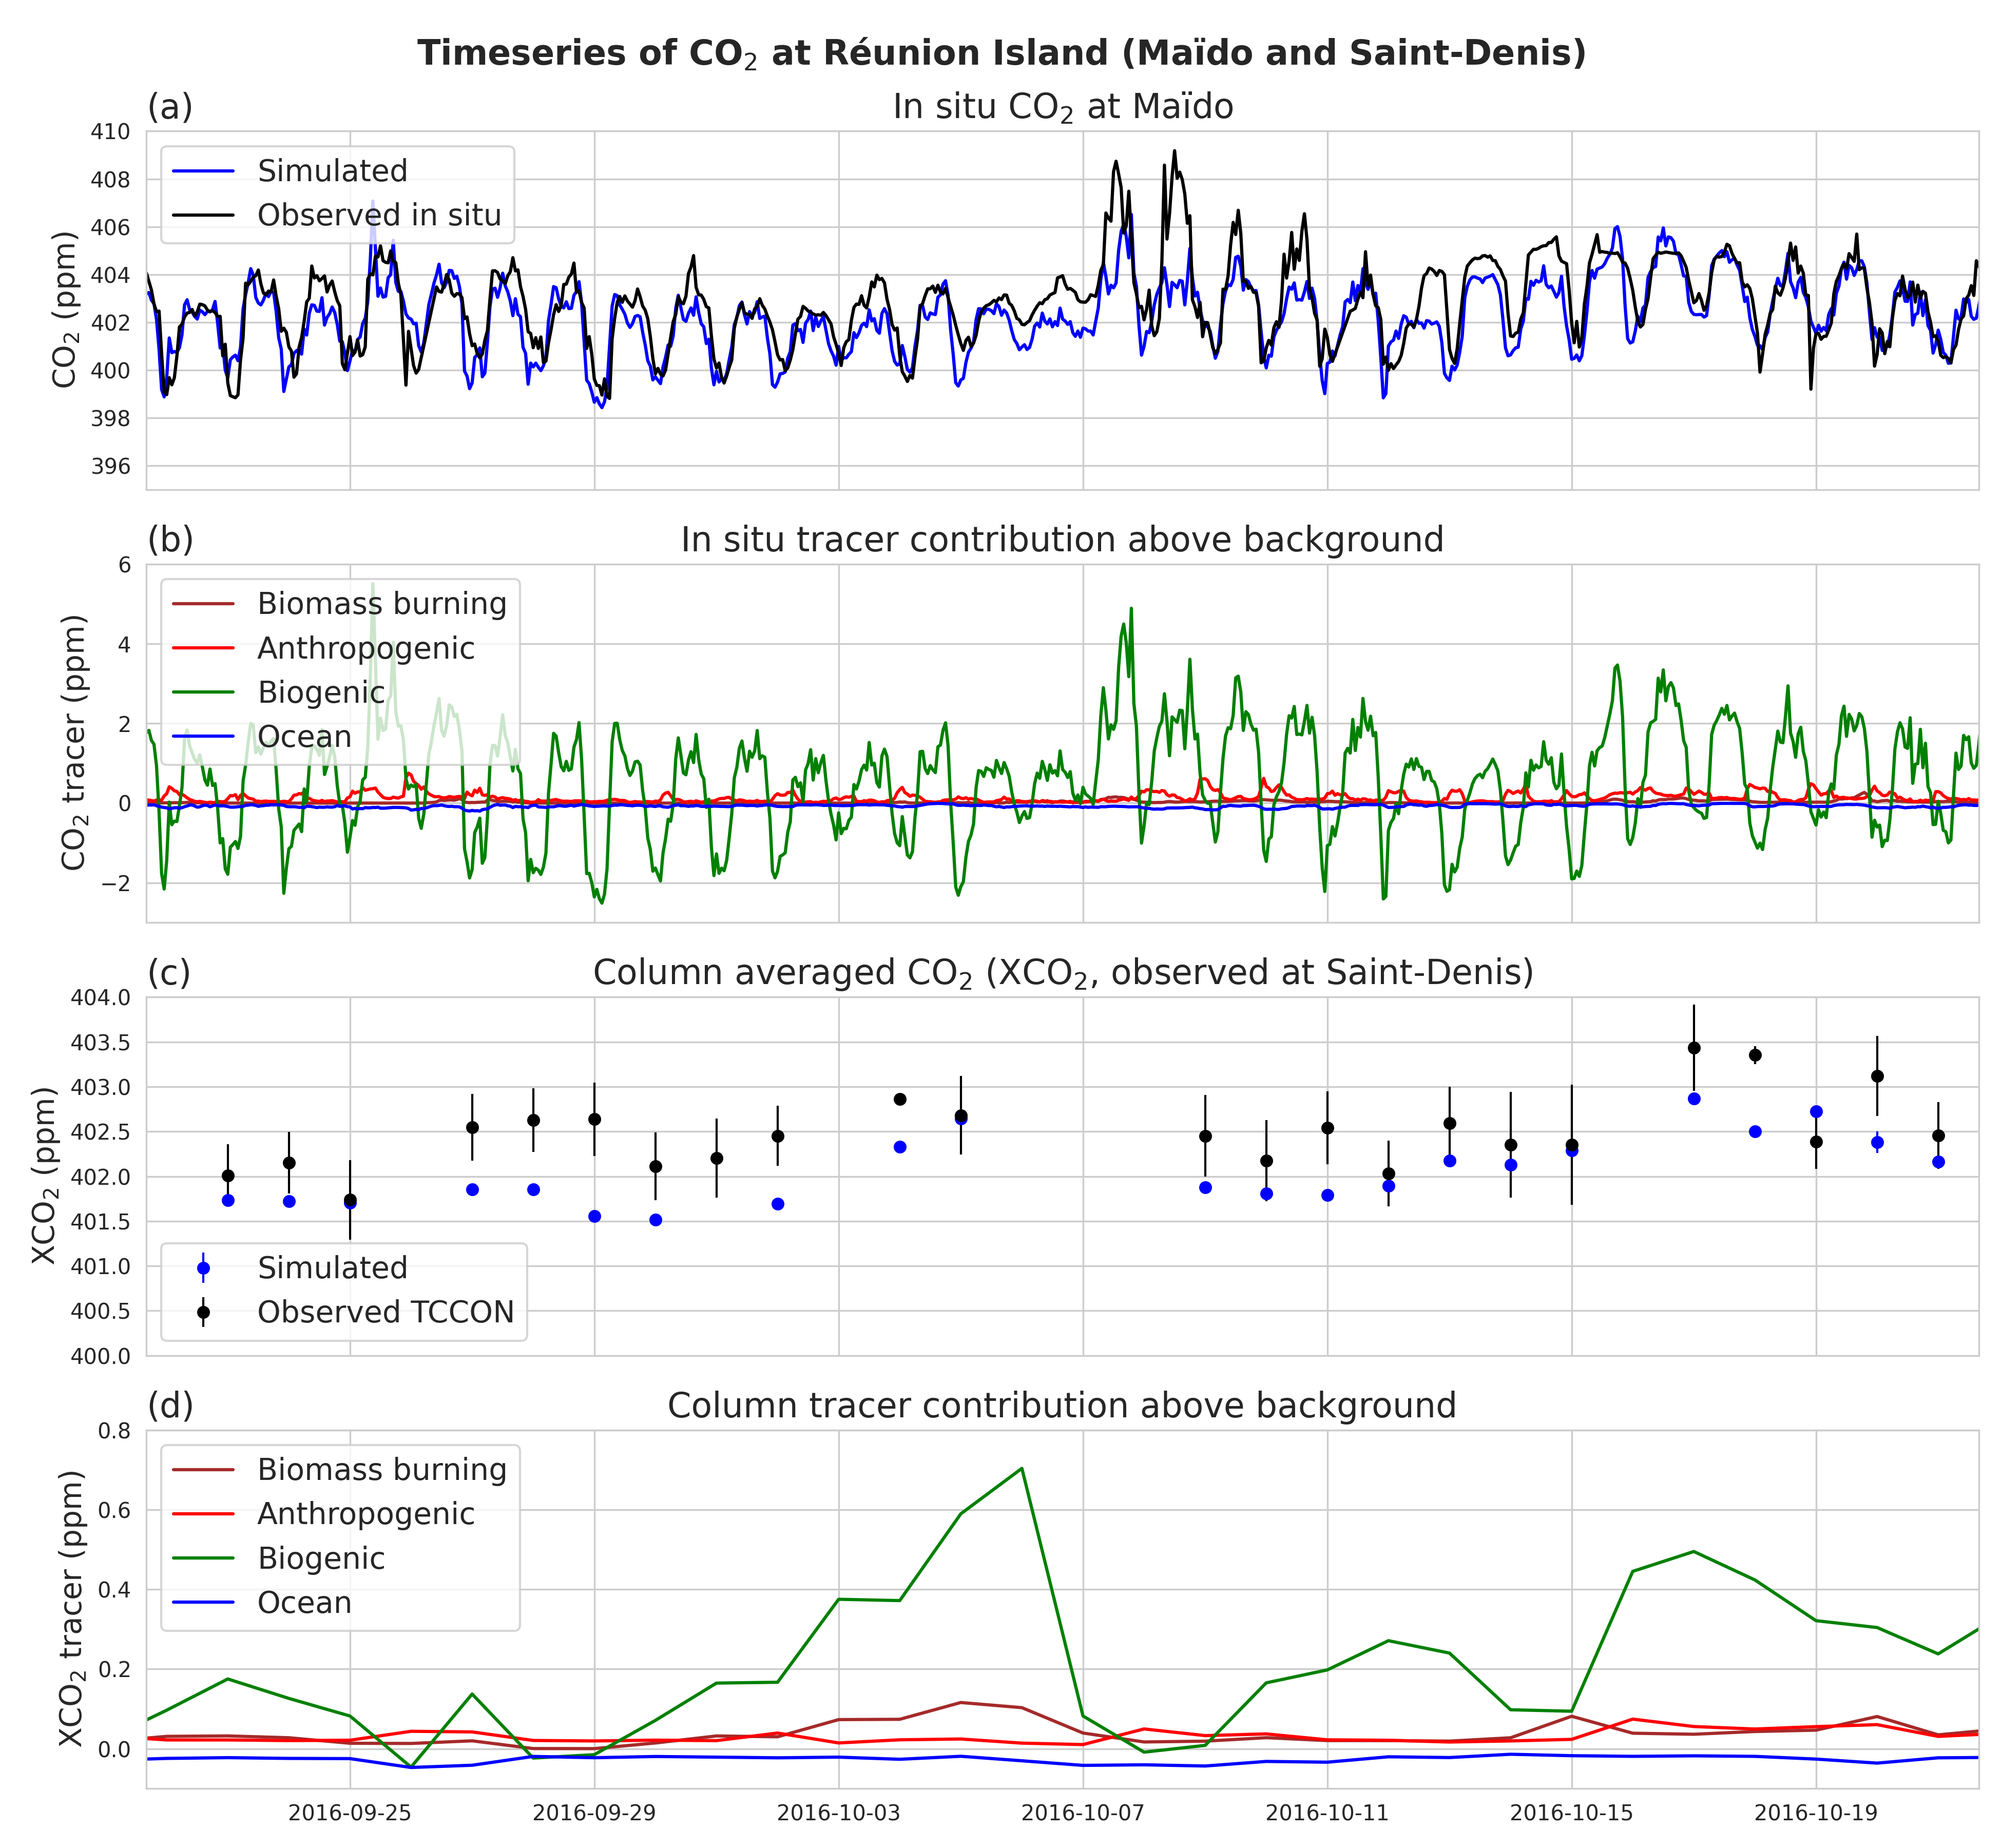
The simulations confirmed that in situ and column observations provide complementary information about the influencing processes. The variability of the surface measurements is mostly caused by local fluxes and atmospheric dynamics.
Local fluxes are those that are produced close to the instrument, primarily by anthropogenic sources in the capital (burning of fossil fuels) or biogenic sources (photosynthesis and respiration of vegetation) at the top of the Maïdo mountain.
Large-scale mechanisms
Additionally, atmospheric dynamics such as wind speed and direction have a large impact on the local concentrations. Strong winds quickly mix gases in the atmosphere, but weak breezes can allow accumulation of concentrations close to their sources.
The column observations are more sensitive to the larger scale: they are influenced by emissions much further away from the instrument and by wind patterns created by large weather systems. As such, the impact of biomass burning plumes from the African or even South-American continents can be detected at Réunion Island.
Both types of observations are required to get a better insight into the carbon cycle. Moreover, the WRF-GHG model has proven to be a very useful tool to achieve this goal.
Currently, a similar study is ongoing at the Xianghe site, near Beijing in China. In the future, this model will also be used to verify emissions of CO2, CH4, and CO in Belgium.
Reference
Callewaert, S., Brioude, J., Langerock, B., Duflot, V., Fonteyn, D., Müller, J.-F., Metzger, J.-M., Hermans, C., Kumps, N., Ramonet, M., Lopez, M., Mahieu, E., & De Mazière, M. (2022). Analysis of CO2, CH4, and CO surface and column concentrations observed at Réunion Island by assessing WRF-Chem simulations. Atmospheric Chemistry and Physics, 22(11), 7763–7792. https://doi.org/10.5194/acp-22-7763-2022